
")
Analysis of Variance Table (ANOVA –Table)
An analysis of variance table the between and within-group variability is presented as “sums of squares” in the analysis of variance table (ANOVA table). ANOVA summary table for testing the significance of a set of regression coefficients in a multiple regression model with k independent variables.
| Source | Degree of freedom (d.f.) | Sum of Square | Mean Square | F-statistics |
| Regression | k | SSR | ||
| Error | n-k-1 | SSE | ||
| Total | n-1 | SST |
F-Test:
This test is used to test the significance of the multiple regression model. By using this F-test, we can determine whether there is a significant relationship between the dependent variable and the set of independent variables i.e. we can determine the overall fit of the regression model.
The null and alternative hypotheses are set as
Null hypothesis (H0): β1 = β2 = β3 = . . . . . . . . . . . …. = βk (This means, no linear relationship between the dependent variable and the independent variables)
Alternative hypothesis (H1): At least one βj ![]() 0 (This means, a linear relationship exists between the dependent variable and at least one of the independent variables)
0 (This means, a linear relationship exists between the dependent variable and at least one of the independent variables)
Test statistics
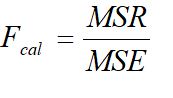
It follows F-distribution with k and n-k-1 degree of freedom.
Decision
If Fcal < F (k, n-k-1),![]() /2 then null hypothesis (H0) is accepted otherwise alternative hypothesis (H1) is accepted.
/2 then null hypothesis (H0) is accepted otherwise alternative hypothesis (H1) is accepted.
Note: To obtain the value of F (k, n-k-1),![]() /2 see the k degree of freedom along a horizontal and n-k-1 degree of freedom along vertical at µ level of significance.
/2 see the k degree of freedom along a horizontal and n-k-1 degree of freedom along vertical at µ level of significance.
When the degree of freedom cannot be found in the table, the closest value on the smaller side should be used.
The Quadratic Regression Model:
The quadratic regression model is similar to the multiple regression model with two independent variables. The quadratic regression model between a dependent variable (y) and independent variable (x1) is defined as,
![]()
Where,
Y = dependent variable
x1 = independent variable.
β0 = y-intercept
β1 = Coefficient of the linear effect on y.
β2 = Coefficient of the quadratic effect on y.
e = Error term.
To fit this quadratic model, we need the estimated value of β0, β1, and β2.
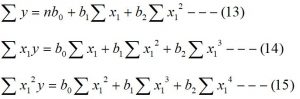
By solving the above three normal equations we can find the estimated value β0, β1, and β2 of β0, β1, and β2 respectively.
Hence the fitted quadratic model is
![]()
b0 = Estimate value of β0 = y-intercept.
b1 = Estimated value of β1 = Coefficient of the linear effect on y.
b2 = Estimated value of β2 = Coefficient of the quadratic effect on y.
![]() = Estimated value of the dependent variable for given values of the independent variable.
= Estimated value of the dependent variable for given values of the independent variable.
Note: To test the significance of the quadratic model, we have to use the f-test as describe above by setting null and alternative hypothesis as
Null hypothesis (H0): β1 = β2 = 0 (This means, no overall relationship between the dependent variable (y) and the independent variable (x1)
Alternative hypothesis (H1): at least β1 or β2 ![]() 0 (This means, overall relationship exists between the dependent variable (y) and independent variable (x1).
0 (This means, overall relationship exists between the dependent variable (y) and independent variable (x1).
You may also like: Measure of variation in the multiple regression model
Leave a Reply