

The measure of variation in the multiple regression model
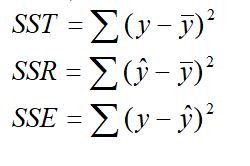
There are three measures of variation in the multiple regression model that determine “ how much of the variation in Y (the dependent variable) could be explained by the variation in X (the independent variable) ”.To examine the ability of the set of independent variables to predict the dependent variable (y) in the multiple regression analysis, several measures of variation need to be developed. In multiple regression analysis, the total variation or total sum of squares (SST) is subdivided into explained variation or regression sum of squares (SSR) and unexplained variation or error sum of squares (SSE).
Mathematically, The measures of variation in the multiple regression model is given as
Total Sum of Square (SST) = Regression Sum of Square (SSR) + Error Sum of Square (SSE) i.e.
SST=SSR+SSE———(7)
where
Standard Error of the Estimate for multiple regression model (Se):
We already discussed the meaning of the standard error of the estimate in the simple regression model. In a multiple regression model, the standard error of the estimate is calculated by using the following relation.
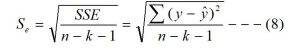
Where ‘k’ is the number of independents variables. The other notations have their usual meanings.
The interpretation of the standard error of the estimate is already discussed in the simple regression model.
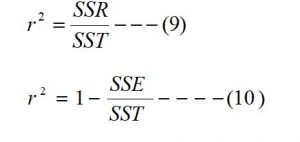
Coefficients of Multiple Determination (r2):
The coefficient of multiple determination measures the proportion of variation in the dependent variable (y) that is explained by the set of independents variables. The following relation is used to obtain the coefficient multiple of determination in the multiple regression analysis.
Adjusted Coefficient of Multiple Determination (r2adj):
The adjusted coefficient of multiple determination is obtained by using the following relation.
![]()
Where
r2 = coefficient of multiple determination.
r2adj = adjusted coefficients of multiple determination.
k= number of independent variables.
n = number of pairs of data.
SST = Total sum of the square.
SSE = Sum of square due to error.
SSR = Sum of square due to regression.
Confidence Interval Estimation of Multiple Regression coefficient:
In multiple regression analysis, a confidence interval estimate for the population slope (or multiple regression coefficients) is obtained by using the following relation.
![]()
By putting the value of j = 1, 2, 3, 4… k. in the above relation, we can obtain the interval estimation of b1, b2, b3, b4, …………….,bk respectively.
Where,
bj = Estimated value of bj or Regression coefficients of the dependent variable (y) with the independent variable (xj) holding the effect of other independent variables constant.
![]() = Standard error of the regression coefficients bj.
= Standard error of the regression coefficients bj.
n = number of pairs of data.
k = number of independent variables.
![]() = Tabulated value of ‘t’ obtained from two-tailed student’s t-table at (n-k-1) degree of freedom and ‘µ’ level of significance.
= Tabulated value of ‘t’ obtained from two-tailed student’s t-table at (n-k-1) degree of freedom and ‘µ’ level of significance.
Approximate prediction interval:
This interval is used to obtain within which two values, the actual value of the dependent variable lies. The following relation is used to obtain the approximate prediction interval.
Approximate prediction interval:
This interval is used to obtain within which two values, the actual value of the dependent variable lies. The following relation is used to obtain the approximate prediction interval.
![]()
![]() = Estimated value of the dependent variable for a given value of a set of independent variables.
= Estimated value of the dependent variable for a given value of a set of independent variables.
The other notations have their usual meaning.
Test of significance for the regression coefficients:
To determine the existence of a significant linear relationship between the dependent variable (y) and independent variables, a hypothesis test concerning the population slope (Regression coefficient) is made by setting the null and alternative hypothesis as stated below.
Null hypothesis (H0): bj = 0 This means there is no linear relationship between a dependent (y) and independent variables (xj)
Alternative hypothesis (H1): bj 0 This means there is a significant linear relationship between a dependent (y) and independent variable (xj) (Two-tailed)
If the null hypothesis is accepted then you can conclude that there is no relationship between dependent and independent variables. But if an alternative hypothesis is accepted then you can conclude that there is a significant relationship between dependent and independent variables.
Test Statistics:
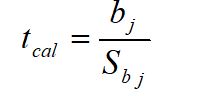
This test statistics follow t-distribution with (n-k-1) degree of freedom.
Decision: if the calculated value of the test statistics (tcal) is less than the tabulated value (ttab) then the null hypothesis is accepted otherwise alternative hypothesis is accepted i.e.
If tcal < t![]() , n-k-1, then the null hypothesis is accepted. Otherwise, t an alternative hypothesis is accepted.
, n-k-1, then the null hypothesis is accepted. Otherwise, t an alternative hypothesis is accepted.
Where
t![]() , n-k-1 = tabulated value of ‘t’ at (n-k-1) degree of freedom and ‘
, n-k-1 = tabulated value of ‘t’ at (n-k-1) degree of freedom and ‘![]() ’ level of significance, obtained from two-tailed t-table.
’ level of significance, obtained from two-tailed t-table.
n = number of pairs of data.
![]() = level of significance
= level of significance
bj = Regression coefficients of y on xj.
![]() = Standard error of the regression coefficient (bj)
= Standard error of the regression coefficient (bj)
You may also like: Multiple Regression Analysis
Leave a Reply