

Network Models
1. Introduction:
Network models is a technique for planning, scheduling, controlling, and monitoring the progress of large and complex projects, which includes a large number of activities (tasks). Hence, network analysis is a technique of sequencing problems, which is concerned with minimizing the total completion time of the project, overall cost of the project, and so on.
A project is a combination of interrelated activities, which must be executed in a certain order before the entire task can be completed. A large and complex project which is interrelated with a number of activities requires more manpower, machine, and materials. So, it is not possible for the management to make and execute an optimum schedule just by institution based on the organizational capabilities and work experience. So, to meet the objective (goal) of systematic planning, we use two methods in network analysis.
- Critical Path Method (CPM)
- Program Evaluation and Review Technique (PERT)
Critical Path Method (CPM):
The critical path method (CPM) was developed by Dupont and Spary Rend Corporation in 1957. CPM is effectively used for the planning, scheduling, and controlling of commercial projects and development. CPM networks are generally used for repetitive types of projects or for those projects for which a fairly accurate estimate of time for the completion of each activity can be made and also cost estimation can be made with a fair degree of accuracy.
However, it is not suitable for research and development projects. CPM includes the concept of both cost and completion time for each activity of the project in the planning and controlling process. CPM is basically concerned with obtaining the cost and completion time of a project.
Program Evaluation and Review Technique (PERT):
Program Evaluation and Review Technique (PERT) was developed by Booz, Allen, and Hamilton, a management consulting firm, in 1958. PERT is a technique for planning, scheduling, and controlling the project. PERT is used most frequently in research and development-type projects. PERT system is preferred for those projects of operations that are of nonrepetitive nature or for those projects in which correct time determination can not be made, where we use probability to estimate the time required to perform each activity and whole project. PERT system is applicable in projects, where much of their design and construction or production requires new developments in materials and technology.
2. Basic terms that are essential to be familiar with the network diagram are defined as:
- Activity: An activity is a physically identifiable part (task) of a project, which consumes time and resources to complete a particular part of the entire project. In-network diagram, an activity is represented by an arrow, the tail of an arrow represents the start and the head represents the end (finish) of an activity. The activities can be further classified into the following three categories.
- Predecessor activity: An activity, which must be completed before one or more other activities start, is known as predecessor activity.
- Successor activity: An activity, which started immediately after one or more predecessor activities have been completed, is known as successor activity.
- Dummy activity: An activity, which does not consume time and resources, is known as a dummy activity. A dummy activity in the network diagram is added only to represent the given precedence relationships among activities of the project. A dummy activity is depicted by the dotted line in the network diagram. A dummy activity is needed when: –
Two or more parallel activities in a project have the same head and tail events and
Two or more activities have some (but not all) of their immediate predecessor activities are common. - Event (node): The beginning and ending points of activity are called events or nodes. Events are represented by a numbered circle. The head event say the jth event has always a higher number than the tail event say ith i.e. j > i
3. Rules for constructing the network diagram:
Following are some of the rules, which have to be followed while constructing a network diagram.
- In a network diagram, arrows represent activities and circles represent the events. The length of an arrow has no significant meaning.
- Each activity should be represented by only one arrow and must start and end in a circle. The tail of activity represents the start and the head of activity represents the completion of an activity.
- The event numbered 1 denotes the start of the project and is called an initial event. All activities emerging from event 1 should not be preceded by any other activity. The event carrying the highest number denotes the completion of the project. A network should have only one initial event and only one terminal event.
- The general rule for numbering the event is that the number at an activity’s head should always be larger than that at its tail.
- An activity must be uniquely identified by its starting and completion event, which implies that
- An event number should not get repeated or duplicated
- Two activities should not be identified by the same completion events and same starting event.
- Activities must be represented either by their symbols or by the corresponding ordered pair of starting–completion events.
- The logical sequence between activities must follow the following rules
- An event can not occur until all the incoming activities into it have been completed.
- An Activity can not start unless all the preceding activities on which it depends have been completed.
- Though a dummy activity does not consume either any resource or time, it must follow the rules (a) and (b).
4. Critical path:
The longest path through the network is called the Critical path, which consists of the sequence of those events and connected activities that requires the minimum time for the completion of the project. The length of the critical path determines the minimum time required for the completion of the whole project. The activities associated with this path are called critical activities and the remaining paths in the network are called non-critical paths and activities associated with this non-critical path are called non-critical activities. In the network diagram, there may be more than one critical path. Note that, slack time for those activities which lie in the critical path is always zero.
5. Calculation of activity time:
- Earliest start time (ES): The earliest start time for an activity is the earliest possible time that an activity can start on the assumption that all activities preceding it started at the earliest possible time. The earliest start time (ES) for all the first activities is always equal to zero.
- Earliest finish time (EF): The earliest finish time (EF) for an activity is the earliest possible time that an activity is expected to finish. It is the sum of the earliest start time (ES) and the estimated time (te) to perform the concerning activity. i.e.
EF = ES + te
- Latest finish time (LF): The latest finish time (LF) for an activity is the latest possible time that an activity is expected to finish without delaying the project beyond its deadline assuming that all the subsequent activities are performed as planned.
The latest finish time (LF) for all the last activities is equal to the largest earliest finish time (EF) among all the last activities.
- Latest start time (LS): The latest start time (LS) for an activity is the latest possible time that an activity is expected to start.
The latest start time for an activity is the difference between the latest finish time (LF) and the estimated time (te) of the activity to be performed. i.e.
LS = LF – te.
6. Method of obtaining the earliest start time (ES) and earliest finish time (EF):
The earliest start time and earliest finish time are obtained by using the following systematic steps.
- Take the earliest start time (ES) for all the first activity equal to zero.
- Add estimated time (te) to perform the first activity to its earliest start time (ES) to obtain the earliest finish time (EF) for the first activity.
- Take any activity for which all of its immediate preceding activities have ES and EF values. ES of such an activity is equal to the largest of the EF values of its immediately preceding activities.
Proceed in this way from left to right to find the ES and EF of all the activities in the network. This process of finding ES and EF for all activities is called the forward pass method.
7. Method of obtaining the latest start time (LS) and latest finish time (LF):
The latest start time (LS) and latest finish time (LF) are obtained by using the following systematic steps.
- Start at the end of the network diagram.
- Take the LF for all the last activities equal to the largest EF among all the last activities.
- Subtract the estimated time (te) to perform the last activity from its LF to obtain its LS
- Take any activity for which all of its immediate succeeding activities have LS and LF values.
- The LF of such an activity is equal to the smallest of the LS values of its immediate succeeding activities.
- Proceed in this manner from right to left of finding the LS and LF of all activities in the network. This process of finding LS and LF for all activities is called the backward pass method.
8. Slack time (Total Float):
The difference between the earliest time and the latest time of an activity is called slack time. Slack time is defined as the time span by which the starting or finishing of an activity can be delayed without delaying the completion of the project.
Slack time = LS – ES
OR
Slack time = LF – EF
The slack time for all the critical activities is always equal to zero.
9. Time estimates of an activity:
In the PERT network, there is uncertainty about the times required for the completion of various activities. Hence three-time estimates are made.
- Optimistic time (t0 or a): This is the shortest possible time in which an activity can be completed under ideal conditions i.e. shortest possible time required for the completion of an activity is called optimistic time and is denoted by to or a.
- Pessimistic time (tp or b): The maximum time (longest time) that an activity will take is called pessimistic time and is denoted by tp or b.
- Most likely time estimate ( tm or m): The most likely time is the time that an activity will take if executed under normal condition and most likely time lies between optimistic and pessimistic time and it is denoted by tm or m.
Expected time or estimated time (te or µ):
In the case of the PERT network, the estimated time required to complete an activity is obtained by using the following relation.
te =(a+4m+b)/6
Where a = optimistic time
b = pessimistic time
m = most likely time
Standard deviation and variance:
a. Standard deviation of an activity (σ) =(b-a)/6
The square of the standard deviation is called variance and it is denoted by σ².
b. Variance of the time required to complete the whole project is calculated by using the following relations
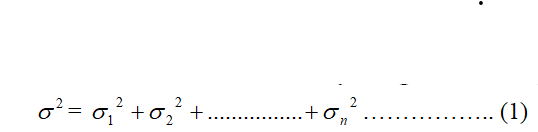
The positive square root of the variance is called standard deviation. Where 1, 2 … n are the standard deviation of the first; second ……….and nth activity lies on the critical path respectively.
10 Probability in PERT Analysis:
Method of obtaining the probability of the project completion time
By using the normal distribution (normal table), we can obtain the probability of the project completion time. The standard normal variable is defined as
Z = (Ts-µ)/σ
Where
TS is the scheduled time or given time
µ or te is the length of the critical path or estimated time required for the completion of the project.
is the standard deviation of the whole project and it is calculated by using the above relation (1).
- Note
- When Z is positive, the probability of completing the project in time is more than 50%
- When Z is negative, the probability of completing the project in time is less than 50%
- When Z is zero, the probability of completing the project in time is fifty-fifty percent.
You may also like Time Series.
If you liked our Html Editor, also follow us on Facebook: Bcis Notes.
Leave a Reply