

Simple correlation
Correlation is a statistical method used to determine whether a relationship between two or more variables exists. It shows the strength of a relationship between two variables and is expressed numerically by its coefficient. When it is used to measure the relationship between two variables then it is called simple correlation. When the value of both variables increases (or decreases) in the same direction at the same time then it is called a positive correlation. But when the value of one variable is increased while the value of another variable is decreased at the same time then it is called negative correlation.
1 Method of measuring the correlation between two variables say ‘X’ and ‘Y’
- The Scatter diagram (Scatter Plot)
- Karl Pearson’s correlation coefficient (r)(i) Scatter diagram:
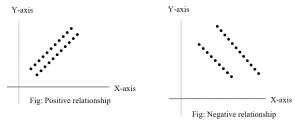
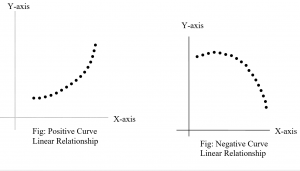
A Scatter diagram is the graphical method of measuring the relationship between two variables. In scatter plot, Pairs of data are plot in the graph by plotting the values of one variable along the X-axis and values of another variable along the Y-axis. A scatter of point so formed is called the scatter plot. If these plotted points show some trend either upward or downward then two variables are said to be correlated if these plotted points do not show any trend then two variables are said to be uncorrelated. Some types of relationships obtained by scatter plots are shown in the following figure.
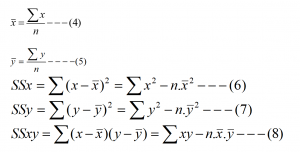
ii) Karl Pearson’s (r): The coefficient of correlation between two variables say ‘X’ and ‘Y’ defined by Karl Pearson’s to measure the strength of the relationship between these two variables is denoted by ‘r’ and its value always lies between -1 and +1 and is calculated by using the following relations.
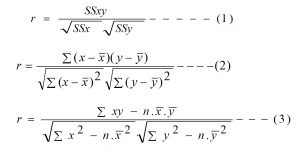
Where
r = Correlation coefficient and its value always lies between -1 and +1
n = Number of pairs of data.
3 Interpretation (r)
If r = 0, this means there is no correlation (relation) between two variables.
If r > 0, this means there is a positive correlation between the two variables.
If r < 0, this means there is a negative correlation between the two variables.
If r = -1, this means there is a highly (perfect) negative relationship between two variables.
If r = +1, this means there is a highly positive relationship between the two variables.
4 Test of significance:
The test statistics to test the significance of the correlation coefficient are obtained under the assumption that in the null hypothesis, the population correlation coefficient is set to be zero. Thus, the null and alternative hypotheses are set as
Null hypothesis
(H0): β = 0 (This null hypothesis means that there is no correlation between the x and y variables in the population.)
Alternative hypothesis
(H1): β ≠ 0 (This alternative hypothesis means that there is a significant correlation between the x and y variables in the population). (Two-tailed)
If the null hypothesis is accepted then you can conclude that there is no association between the two variables. But if an alternative hypothesis is accepted then you can conclude that there is a significant association between the two variables.
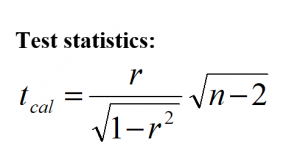
It follows the student’s t-distribution with (n-2) degree of freedom.
Decision: if the calculated value of the test statistics (tcal) is less than the tabulated value (ttab) then null hypothesis is accepted otherwise null hypothesis is rejected. i.e.
If tcal < tµ, n-2, then null hypothesis is accepted. Otherwise, the alternative hypothesis is accepted.
Where
tµ, n-2 = tabulated value of ‘t’ at (n-2) degree of freedom and ‘µ’ level of significance, obtained from two-tailed t-table.
n = number of pairs of data.
µ = level of significance
r = sample correlation coefficient
You may also like: Simple Regression Analysis || Data Analysis and Modeling || BCIS NOTES.
Leave a Reply