
Market Structure
Perfect Competition- The situation prevailing in a market in which buyers and sellers are so numerous and well informed that all elements of monopoly are absent and the market price of a commodity is beyond the control of individual buyers and sellers are said to be perfect competition.
Characteristics:-
- Large numbers of sellers and buyers
- Homogeneous products
- Free entry and exit of firms
- Price taker
- AR and MR are constant
- No selling cost
Perfect competition revenue schedule
| Quantity | Price | Total Revenue | Average revenue | Marginal revenue |
| 1 | 10 | 10 | 10 | 10 |
| 2 | 10 | 20 | 10 | 10 |
| 3 | 10 | 30 | 10 | 10 |
| 4 | 10 | 40 | 10 | 10 |
| 5 | 10 | 50 | 10 | 10 |
| 6 | 10 | 60 | 10 | 10 |
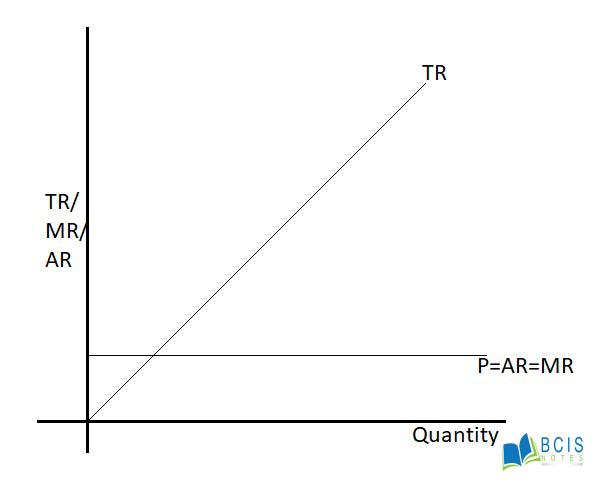
In the figure, TR is the total revenue curve. It begins from the origin which shows that total revenue is zero when quantity sold is nil. It moves upwards which means that total revenue increases when the quantity sold increases. AR is the average revenue or demand curve. It is horizontal straight line parallel to x-axis which indicates that price remains constant even if the quantity sold increases.
Imperfect competition- The situation prevailing in a market in which elements of monopoly allow individual producers or consumers to exercise some control over market prices are said to be the imperfect competition.
Types:
- Monopoly Market
- Single sellers.
- Price discrimination
- No free entry and exit of firms/restriction
- Price maker
- AR and MR are not constant i.e. different
- Low selling cost
- Incomplete information
2. Monopolistic Market
- Many sellers and buyers
- Product differentiation
- Price maker
- Relatively easy market entry
- Large selling cost
- AR and MR are different
- Incomplete information
3. Oligopoly
- Few sellers
- Act like monopoly
- High dependency between firms
- AR and MR are different
- Low selling Cost
- The entry of new firms is restricted
Imperfect Competition revenue schedule
| Output | Price | Total Revenue | Marginal revenue | Average revenue |
| 1 | 50 | 50 | 50 | 50 |
| 2 | 40 | 80 | 30 | 40 |
| 3 | 30 | 90 | 10 | 30 |
| 4 | 20 | 80 | -10 | 20 |
| 5 | 10 | 50 | -20 | 10 |
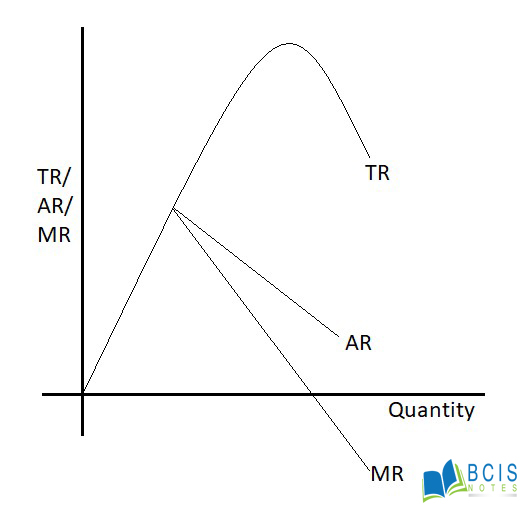
We measure, MR/AR/TR in y-axis and quantity in x-axis respectively.
In the above figure, TR is the total revenue curve, which passes through the origin, implying that TR is zero when the quantity sold is zero. The average revenue (AR) and marginal revenue (MR) are the downward sloping straight line.
Therefore the market structure is explained above.
you may also like the Relationship between AR and MR
Leave a Reply